3D foot scanning with the iPhone: what it measures, how accurately and what we still do not know
Consumer depth sensors can already capture foot shape with errors of a few millimetres under controlled conditions. For the iPhone's TrueDepth camera, however, the published evidence amounts to a single small study.
- A fixed 3D scanner measured foot dimensions with a mean absolute difference of 0.6–4.3 mm against conventional methods 1.
- A consumer depth sensor (Kinect) achieved an RMSE below 3 mm over the plantar surface and below 1.6 mm at the arch, against a laser scanner 2.
- A low-cost structured-light sensor had a bias of 0.5 mm, but limits of agreement of about ±12 mm 3.
- In the only verified study using TrueDepth (iPhone X), reliability was above 0.9 on the length and width axes and below 0.75 on the vertical axis 4.
- The arch height index (AHI) has a normative value of 0.340 ± 0.030 in recreational runners 5.
- Different foot measurement methods are not interchangeable: compare scans with scans 1.
Why measure the foot in 3D
Length, width and arch height are used in footwear selection, in the design of insoles and orthoses, and in describing foot posture in athletes and patients. Traditionally they are measured with a calliper, ruler, ink footprint or dedicated devices, all of which depend on the assessor. 3D scanning promises more objective and reproducible measurements, and a record of the whole foot shape that can be compared over time.
In a study of 130 adults, 3D scanning was the most precise of four methods (digital calliper, ink footprint, digital footprint and 3D scanner), with mean absolute differences of 0.73–1.50 mm between repeated measurements 1. The same study showed that the method had a significant effect on all six dimensions assessed, with a practical consequence: values obtained with different methods should not be compared directly 1.
How scanning works and what depth sensors show
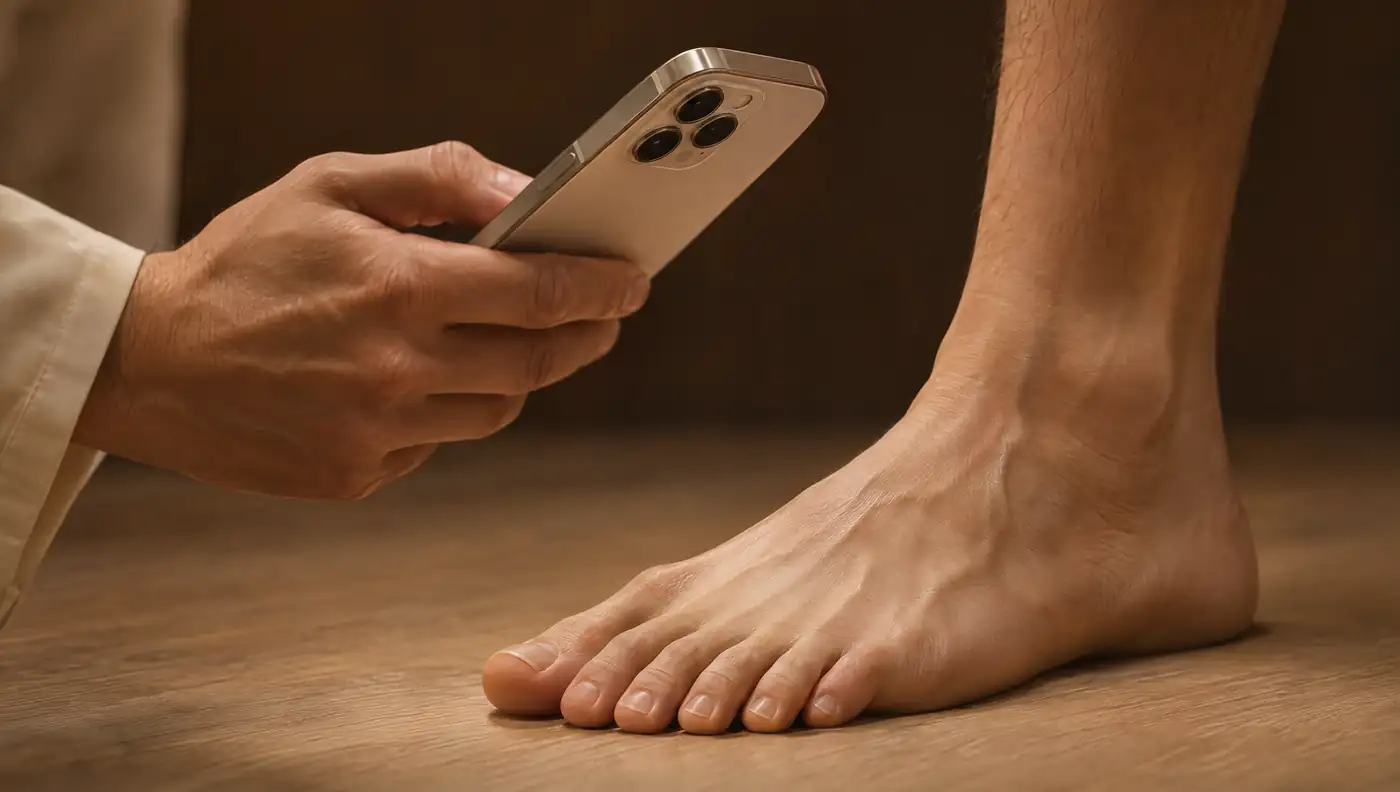
The iPhone's TrueDepth camera, used for Face ID, is a short-range depth sensor based on structured light, the same principle as dedicated sensors such as the Structure Sensor. It is a different approach from photogrammetry, which reconstructs shape from many photographs. The accuracy of these sensors depends heavily on the set-up and the protocol.
In a Kinect-based device, with a support platform and the foot weight-bearing, the error against a high-resolution laser scanner was below 3 mm over the whole plantar surface and below 1.6 mm in the arch region, with between-session repeatability of 1.2 ± 0.4 mm 2. In children requiring ankle–foot orthoses, a low-cost structured-light sensor (Structure Sensor II) had a mean accuracy of 0.6 ± 7.4% at anatomical landmarks against the plaster cast, and the fastest capture, with two operators, took 26.4 ± 11.1 s 3.
| Method | Comparison and sample | Result |
|---|---|---|
| Fixed 3D scanner | Digital calliper and footprints; 130 adults | Mean absolute difference 0.6–4.3 mm; between-method ICC 0.61–0.98 1 |
| Kinect with platform, weight-bearing | Laser scanner; 14 healthy adults | RMSE < 3 mm (plantar surface) and < 1.6 mm (arch) 2 |
| Structure Sensor II (structured light) | Plaster cast; 10 children | Bias 0.5 mm; limits of agreement −12.4 to 13.5 mm 3 |
| iPhone X (TrueDepth) | Comparison with Structure iSense; 14 feet from 7 adults | ICC > 0.9 on the X and Y axes; < 0.75 on the Z axis 4 |
The studies use different references, populations and anatomical landmarks, so the values are not directly comparable with one another.
What the evidence says about the TrueDepth camera
We found a single published study that assessed the TrueDepth camera for foot scanning. Alfaro-Santafé and colleagues compared the iPhone X with the Structure iSense scanner in 14 feet from 7 healthy adults, measuring distances between anatomical landmarks (1st and 5th metatarsal heads, heel and navicular tuberosity) on all three axes 4. Reliability of the iPhone X, expressed as ICC, was above 0.9 on the X and Y axes but below 0.75 on the Z axis, the vertical one; the Structure iSense exceeded 0.9 on all three axes 4. The standard error of measurement was described as low for both systems.
Length, width and arch height
Length and width are the most robust measures: they correspond to the axes on which TrueDepth was reliable 4 and to those on which 3D scanners show errors of a few millimetres 1. Arch height is more demanding, because it depends on the vertical axis and on the load applied to the foot at the moment of capture.
The classic way to normalise arch height is the arch height index (AHI). Williams and McClay compared several measures in 102 feet, at 10% and 90% weight-bearing, and concluded that the most reliable and valid measure was dorsal height at 50% of foot length divided by truncated foot length, with inter-rater ICCs of 0.811 at 10% weight-bearing and 0.848 at 90%, and validity against radiography of 0.844 and 0.851 6. With a dedicated device (AHIMS), the AHI showed high inter- and intra-rater reliability and a normative value of 0.340 ± 0.030 in 100 recreational runners, similar between sexes 5.
| Measure | Definition | Reference data |
|---|---|---|
| Arch height index (AHI) | Dorsal height at 50% of foot length ÷ truncated foot length | Inter-rater ICC 0.811–0.848 6; 0.340 ± 0.030 in recreational runners 5 |
| Foot Posture Index (FPI-6) | Six observational components of standing foot posture | Explained 64% of the variance in static posture and 41% of posture at midstance during gait 7 |
An AHI calculated from a scan is not automatically equivalent to the AHI measured with the AHIMS or a calliper. Agreement between methods must be verified before comparing a client's value with published norms 1.
Foot Posture Index: the clinical context
The Foot Posture Index (FPI-6) is the reference observational tool for describing foot posture. It was developed from 36 candidate components, reduced to six, and the final version explained 64% of the variance in static posture and 41% of posture at midstance during gait 7. It allows a multisegmental, multiplanar assessment that is quick and simple to perform 7.
3D scanning and the FPI are therefore complementary. The scan provides objective dimensions, comparable between sides and over time; the FPI provides a clinical classification of foot posture with its own validation. One does not replace the other.
Limitations and clinical use
- Scarce evidence on TrueDepth: one study, 14 feet, healthy adults and a single iPhone model 4.
- Weaker vertical axis: reliability below 0.75 on the Z axis, which mainly affects arch height 4.
- Individual precision: even with a mean bias of 0.5 mm, individual limits reached about ±12 mm with a structured-light sensor 3.
- Loading and set-up: the best results with consumer sensors were obtained with a support platform and the foot weight-bearing 2.
- Methods are not interchangeable: compare the same client using the same method 1.
In practice, 3D foot scanning with the iPhone is most useful for recording length and width, comparing the right foot with the left and following the same client over time. Arch height should be read as an estimate, with more caution than horizontal dimensions, until TrueDepth has been validated against a weight-bearing reference method. Decisions about insoles, footwear or treatment remain clinical.
Frequently asked questions
Is 3D foot scanning with an iPhone accurate?
The evidence is limited. In the only verified study using the TrueDepth camera (iPhone X, 14 feet), reliability was above 0.9 for length and width and below 0.75 on the vertical axis 4.
How is the arch height index calculated and what is a normal value?
Dorsal foot height at 50% of foot length is divided by truncated foot length 6. In 100 recreational runners, the mean value was 0.340 ± 0.030 5.
Does iPhone foot measurement replace the Foot Posture Index?
No. The FPI-6 is a validated observational assessment with six components 7; the scan provides objective dimensions. They are complementary.
Can I compare foot measurements obtained with different methods?
Not directly. The measurement method had a significant effect on all foot dimensions assessed 1; compare the same client using the same method.
References
- Lee YC, Lin G, Wang MJ. Comparing 3D foot scanning with conventional measurement methods. J Foot Ankle Res. 2014;7(1):44. doi.org/10.1186/s13047-014-0044-7
- Rogati G, Leardini A, Ortolani M, Caravaggi P. Validation of a novel Kinect-based device for 3D scanning of the foot plantar surface in weight-bearing. J Foot Ankle Res. 2019;12:46. doi.org/10.1186/s13047-019-0357-7
- Farhan M, Wang JZ, Warncke R, Cheng TL, Burns J. Comparison of accuracy and speed between plaster casting, high-cost and low-cost 3D scanners to capture foot, ankle and lower leg morphology of children requiring ankle-foot orthoses. J Foot Ankle Res. 2024;17(3):e70006. doi.org/10.1002/jfa2.70006
- Alfaro-Santafé J, Gómez-Bernal A, Lanuza-Cerzócimo C, Alfaro-Santafé JV, Pérez-Morcillo A, Almenar-Arasanz AJ. Three-axis measurements with a novel system for 3D plantar foot scanning: iPhone X. Footwear Sci. 2020;12:123–131. doi.org/10.1080/19424280.2020.1734867
- Butler RJ, Hillstrom H, Song J, Richards CJ, Davis IS. Arch height index measurement system: establishment of reliability and normative values. J Am Podiatr Med Assoc. 2008;98(2):102–106. doi.org/10.7547/0980102
- Williams DS, McClay IS. Measurements used to characterize the foot and the medial longitudinal arch: reliability and validity. Phys Ther. 2000;80(9):864–871. doi.org/10.1093/ptj/80.9.864
- Redmond AC, Crosbie J, Ouvrier RA. Development and validation of a novel rating system for scoring standing foot posture: the Foot Posture Index. Clin Biomech (Bristol). 2006;21(1):89–98. doi.org/10.1016/j.clinbiomech.2005.08.002
Educational content for health professionals. It does not replace clinical assessment or reading the original studies.