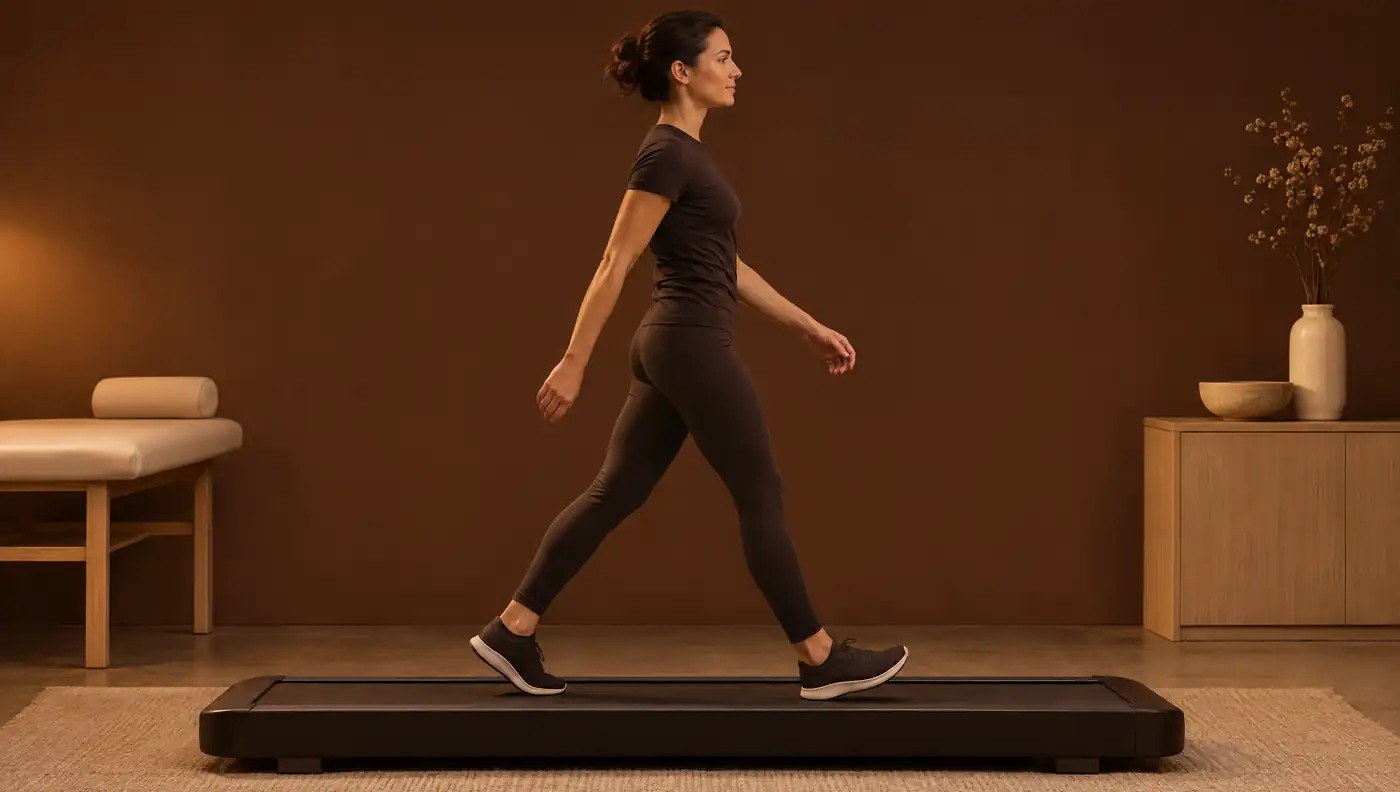
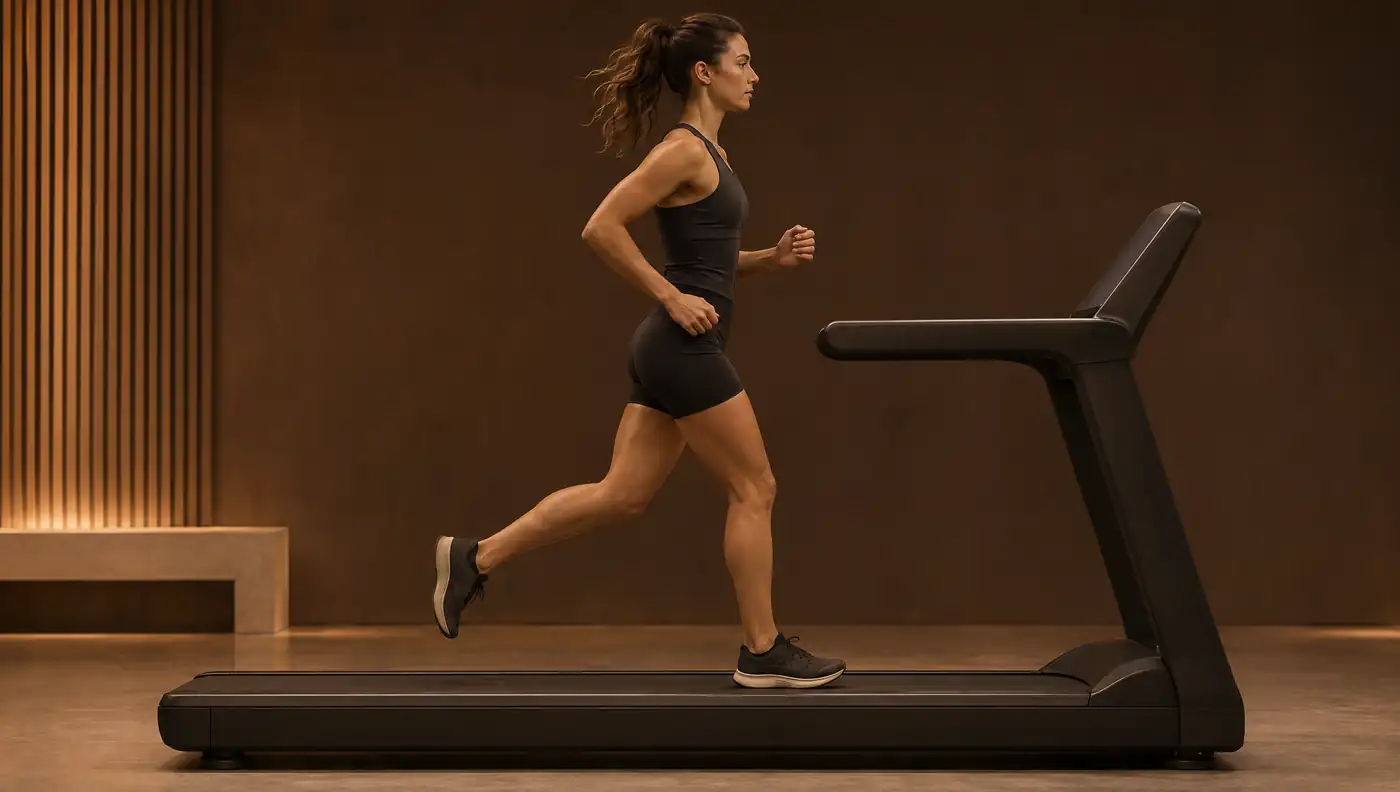
Biomechanical running analysis on the treadmill: cadence, overstride, pelvic drop and crossover
Injured runners tend to share a movement pattern: more pelvic drop, more trunk lean and a straighter knee at contact. Almost all of this can be seen on a well-made 2D video, and some of it can be modified with a simple intervention such as increasing cadence.
- Injured runners had contralateral pelvic drop of 6.4 ± 2.1°, compared with 3.7 ± 1.9° in healthy runners (3D, 3.2 m/s) 1.
- Increasing cadence by 5% and 10% reduced energy absorbed at the knee by about 20% and 34% 2; +10% reduced peak patellofemoral joint force by 14% 3.
- The horizontal distance from heel to centre of mass at initial contact (overstride) predicts braking forces better than tibial angle 4.
- In 2D, most angles are reliable (ICC 0.73–0.99), but pelvic drop is the least reliable (ICC 0.59–0.77); at least 7 steps should be used 5.
- On the treadmill, the foot lands 9.8° flatter and the knee 2.3° more flexed than overground 6.
- Prospective evidence on biomechanical risk factors is scarce and inconsistent 7.
Why running analysis matters
In a study of 72 injured runners (patellofemoral pain, iliotibial band syndrome, medial tibial stress syndrome and Achilles tendinopathy, 18 in each group) and 36 controls, the injured runners ran with more contralateral pelvic drop and more forward trunk lean in midstance. They also landed with a straighter knee and a more dorsiflexed ankle. The pattern was similar across all four groups. Pelvic drop was the variable that best distinguished injured from healthy runners: according to the study abstract, each additional degree increased the odds of being classified as injured by 80% 1.
These variables matter because they can be seen on video and because some respond to running retraining. An evidence synthesis with 16 international experts identified 46 studies on the immediate biomechanical effects of retraining. Evidence on clinical outcomes is limited, and the experts recommend tailoring the approach to each injury and each runner 8.
What we measure and how each variable is defined
- Cadence: steps per minute, the simplest parameter to modify 9.
- Contact time: duration of each foot's stance. It is sensitive to speed and surface; on the treadmill it is slightly longer 6.
- Overstride: the foot lands ahead of the centre of mass, usually with hip flexion and knee extension 9. It is measured as the horizontal distance from heel to centre of mass at initial contact. This distance, speed, foot angle and step length explained 54% of the variance in peak braking force; tibial angle did not contribute 4.
- Knee flexion: at initial contact and at peak during stance. Peak flexion is generally around 45° in midstance. Values well below this may suggest reduced shock absorption, with no formal cut-off 9.
- Hip extension in terminal stance. No optimal value has been established: about 10° may be normal in a slow runner with a short stride 9.
- Contralateral pelvic drop: lowering of the pelvis on the swing-limb side during midstance, in the posterior view.
- Crossover: an excessively narrow base of support, with the feet overlapping the midline in the posterior view. The clinical rule is that right and left foot contacts should not overlap 9.
Knee valgus measured in 2D during running was not related to knee abduction measured in 3D. Pelvic drop and hip adduction in 2D were related to the corresponding 3D profiles 10. In the posterior view, therefore, pelvic drop and hip adduction are more defensible variables than “valgus”.
Standardised protocol and video capture
- Familiarisation: in young adults with no treadmill experience, kinematics stabilised at 6 minutes (ICC 0.95) 11. Souza recommends 6–10 minutes 9.
- Speed: the speed that provokes symptoms or the long-run training pace, always the same at reassessments, because kinematics depend on speed 9. Bramah's values were obtained at 3.2 m/s 1.
- Views: at least two orthogonal views, lateral and posterior, with the camera fixed and perpendicular to the treadmill 9.
- Frame rate: ≥ 120 frames per second 9. The reliability study of qualitative analysis used 120 fps 12.
- Number of steps: the mean stabilised at 6.3 ± 0.3 steps, so the mean of at least 7 steps per side is recommended 5.
Reference values
The most widely cited values come from marker-based 3D analysis on a treadmill at 3.2 m/s. They indicate what to look for and the order of magnitude, but a 2D angle is not numerically equivalent to a 3D angle.
| Variable | Healthy | Injured or threshold | Source |
|---|---|---|---|
| Peak contralateral pelvic drop (midstance) | 3.7 ± 1.9° | 6.4 ± 2.1° (6.3–6.6° across the four injury groups) | 1 |
| Pelvic drop considered aberrant | — | ≥ 5.6° (1 SD above a healthy database) | 13 |
| Hip adduction considered aberrant | — | ≥ 13.2° | 13 |
| Forward trunk lean (midstance) | 9.5 ± 2.9° | 12.0 ± 4.9° | 1 |
| Knee flexion at initial contact | 10.2 ± 4.8° | 6.0 ± 4.9° | 1 |
| Dorsiflexion at initial contact | 2.4 ± 6.5° | 7.2 ± 6.9° | 1 |
| Peak knee flexion in stance | ≈ 45° (clinical guidance) | No formal cut-off | 9 |
| Preferred cadence | 172.6 ± 8.8 steps/min at 2.9 ± 0.5 m/s | — | 2 |
3D treadmill values, except knee flexion (clinical guidance) and cadence (45 recreational runners). In 2D, runners with knee injury also showed more pelvic drop, femoral adduction and hip adduction 14.
Cadence and running retraining: how much and with what effect
In 45 recreational runners, energy absorbed at the knee fell by about 20% with a 5% cadence increase and by about 34% with a 10% increase. Step length, vertical oscillation, braking impulse and heel-to-centre-of-mass distance also decreased. With +10%, peak knee flexion went from 46.3° to 42.8° and peak hip adduction from 10.4° to 8.7°. Perceived exertion increased only with +10% 2. In a musculoskeletal model, +10% reduced peak patellofemoral joint force by 14%, and reduced knee flexion in stance was the main predictor of that reduction 3.
In a real-world setting, asking runners with high impact forces to increase cadence by 7.5% produced an 8.6% increase. Average vertical loading rate fell by 18.9%, hip adduction by 2.9° and eccentric knee work per stance by 26.9%, with the changes maintained at 1 month 15. In a series of 12 runners with patellofemoral pain and aberrant frontal-plane kinematics, one session with a metronome at +10% raised cadence from 165.9 to 184.5 steps/min at 4 weeks. Pelvic drop fell by 3.12°, weekly volume rose by 13.78 km and the gains were maintained at 3 months 13.
Peak braking force was the only prospective kinetic predictor of injury in 65 female recreational runners: the highest tertile had 5.08 times the injury rate of the middle tertile 16. This is a further argument for monitoring overstriding. As for foot-strike pattern, rearfoot strikers had about twice the rate of repetitive stress injuries, in a retrospective study that does not allow causal inference 17.
For crossover, widening the base of support reduced tibial strains 18 and iliotibial band strain 19. It also lowered hip adduction and the knee abduction moment 20.
Reliability and measurement error
| Variable | ICC | Smallest detectable difference |
|---|---|---|
| Lateral trunk position, femoral adduction, foot inclination | 0.90–0.99 | 1.3–2.3° |
| Hip adduction, knee flexion | 0.82–0.89 | 2.3–3.8° |
| Tibial inclination, dorsiflexion | 0.73–0.92 | 2.2–4.8° |
| Contralateral pelvic drop | 0.59–0.77 | 2.7–2.8° |
21 recreational runners, 10 steps per leg 5.
Intra-rater repeatability in 2D can be excellent, with ICCs of 0.958–0.966 for pelvic drop. The relationship with 3D is weaker: moderate for hip adduction (r = 0.539–0.623) and no significant correlation for pelvic drop 21. In qualitative visual analysis, event detection was highly reproducible. Foot position relative to the centre of mass (κw = 0.59) and vertical oscillation (κw = 0.36) had intra-rater agreement below the substantial threshold 12.
Drawing angles manually on smartphone video without markers had poor validity against 3D (ICC 0.06 for hip adduction and 0.42 for knee flexion) 22. With automatic pose estimation on the treadmill, sagittal ranges of motion showed good agreement and frontal pelvis and hip angles did not 23. In a multi-camera smartphone system, tested during walking and running at 8 and 14 km/h, sagittal ranges of motion had ICCs of 0.76–0.93 24.
Clinical interpretation and limitations
- Treadmill versus overground: most measures are comparable. At initial contact, the treadmill gives a 9.8° smaller foot–ground angle, 2.3° more knee flexion and a 5.0 ms longer contact time, with low-certainty evidence 6.
- Speed: only compare assessments performed at the same speed 9.
- Causality: prospective evidence is scarce. There is limited evidence of greater hip adduction in female runners who develop patellofemoral pain or iliotibial band syndrome 7.
- 2D is not 3D: use 3D thresholds as guidance, and give weight to asymmetry and to changes above the smallest detectable difference 5.
- Video identifies targets for intervention; clinical reasoning decides whether the observed pattern is related to the symptoms.
Frequently asked questions
What is the ideal running cadence?
There is no universal value; the 180 steps/min figure comes mainly from running economy studies, not injury studies 9. The evidence supports individual increases of 5–10% over preferred cadence to reduce knee load 2,3.
What is a normal contralateral pelvic drop in running?
In 3D, at 3.2 m/s, healthy runners had 3.7 ± 1.9° and injured runners 6.4 ± 2.1° 1; ≥ 5.6° has been used as a criterion for an aberrant pattern 13. There is no equivalent 2D norm.
What is overstriding and how is it measured on video?
It means landing with the foot ahead of the centre of mass. It is measured as the horizontal distance from heel to centre of mass at initial contact, which was related to braking forces better than tibial angle 4,25.
What is crossover in running and why does it matter?
It is a base of support so narrow that the feet overlap the midline. A narrower base increased tibial strains and iliotibial band strain 18,19.
Is treadmill running analysis valid for road runners?
Largely, yes, but initial contact differs: on the treadmill the foot lands 9.8° flatter and the knee 2.3° more flexed 6.
References
- Bramah C, Preece SJ, Gill N, Herrington L. Is there a pathological gait associated with common soft tissue running injuries? Am J Sports Med. 2018;46(12):3023–3031. doi.org/10.1177/0363546518793657
- Heiderscheit BC, Chumanov ES, Michalski MP, Wille CM, Ryan MB. Effects of step rate manipulation on joint mechanics during running. Med Sci Sports Exerc. 2011;43(2):296–302. doi.org/10.1249/MSS.0b013e3181ebedf4
- Lenhart RL, Thelen DG, Wille CM, Chumanov ES, Heiderscheit BC. Increasing running step rate reduces patellofemoral joint forces. Med Sci Sports Exerc. 2014;46(3):557–564. doi.org/10.1249/MSS.0b013e3182a78c3a
- Napier C, MacLean CL, Maurer J, Taunton JE, Hunt MA. Kinematic correlates of kinetic outcomes associated with running-related injury. J Appl Biomech. 2019;35(2):123–130. doi.org/10.1123/jab.2018-0203
- Dingenen B, Barton C, Janssen T, Benoit A, Malliaras P. Test-retest reliability of two-dimensional video analysis during running. Phys Ther Sport. 2018;33:40–47. doi.org/10.1016/j.ptsp.2018.06.009
- Van Hooren B, Fuller JT, Buckley JD, Miller JR, Sewell K, Rao G, et al. Is motorized treadmill running biomechanically comparable to overground running? A systematic review and meta-analysis of cross-over studies. Sports Med. 2020;50(4):785–813. doi.org/10.1007/s40279-019-01237-z
- Ceyssens L, Vanelderen R, Barton C, Malliaras P, Dingenen B. Biomechanical risk factors associated with running-related injuries: a systematic review. Sports Med. 2019;49(7):1095–1115. doi.org/10.1007/s40279-019-01110-z
- Barton CJ, Bonanno DR, Carr J, Neal BS, Malliaras P, Franklyn-Miller A, et al. Running retraining to treat lower limb injuries: a mixed-methods study of current evidence synthesised with expert opinion. Br J Sports Med. 2016;50(9):513–526. doi.org/10.1136/bjsports-2015-095278
- Souza RB. An evidence-based videotaped running biomechanics analysis. Phys Med Rehabil Clin N Am. 2016;27(1):217–236. doi.org/10.1016/j.pmr.2015.08.006
- Dingenen B, Staes FF, Santermans L, Steurs L, Eerdekens M, Geentjens J, et al. Are two-dimensional measured frontal plane angles related to three-dimensional measured kinematic profiles during running? Phys Ther Sport. 2018;29:84–92. doi.org/10.1016/j.ptsp.2017.02.001
- Lavcanska V, Taylor NF, Schache AG. Familiarization to treadmill running in young unimpaired adults. Hum Mov Sci. 2005;24(4):544–557. doi.org/10.1016/j.humov.2005.08.001
- Pipkin A, Kotecki K, Hetzel S, Heiderscheit B. Reliability of a qualitative video analysis for running. J Orthop Sports Phys Ther. 2016;46(7):556–561. doi.org/10.2519/jospt.2016.6280
- Bramah C, Preece SJ, Gill N, Herrington L. A 10% increase in step rate improves running kinematics and clinical outcomes in runners with patellofemoral pain at 4 weeks and 3 months. Am J Sports Med. 2019;47(14):3406–3413. doi.org/10.1177/0363546519879693
- Dingenen B, Malliaras P, Janssen T, Ceyssens L, Vanelderen R, Barton CJ. Two-dimensional video analysis can discriminate differences in running kinematics between recreational runners with and without running-related knee injury. Phys Ther Sport. 2019;38:184–191. doi.org/10.1016/j.ptsp.2019.05.008
- Willy RW, Buchenic L, Rogacki K, Ackerman J, Schmidt A, Willson JD. In-field gait retraining and mobile monitoring to address running biomechanics associated with tibial stress fracture. Scand J Med Sci Sports. 2016;26(2):197–205. doi.org/10.1111/sms.12413
- Napier C, MacLean CL, Maurer J, Taunton JE, Hunt MA. Kinetic risk factors of running-related injuries in female recreational runners. Scand J Med Sci Sports. 2018;28(10):2164–2172. doi.org/10.1111/sms.13228
- Daoud AI, Geissler GJ, Wang F, Saretsky J, Daoud YA, Lieberman DE. Foot strike and injury rates in endurance runners: a retrospective study. Med Sci Sports Exerc. 2012;44(7):1325–1334. doi.org/10.1249/MSS.0b013e3182465115
- Meardon SA, Derrick TR. Effect of step width manipulation on tibial stress during running. J Biomech. 2014;47(11):2738–2744. doi.org/10.1016/j.jbiomech.2014.04.047
- Meardon SA, Campbell S, Derrick TR. Step width alters iliotibial band strain during running. Sports Biomech. 2012;11(4):464–472. doi.org/10.1080/14763141.2012.699547
- Brindle RA, Milner CE, Zhang S, Fitzhugh EC. Changing step width alters lower extremity biomechanics during running. Gait Posture. 2014;39(1):124–128. doi.org/10.1016/j.gaitpost.2013.06.010
- Maykut JN, Taylor-Haas JA, Paterno MV, DiCesare CA, Ford KR. Concurrent validity and reliability of 2d kinematic analysis of frontal plane motion during running. Int J Sports Phys Ther. 2015;10(2):136–146. pubmed.ncbi.nlm.nih.gov/25883862/
- Neal BS, Lack SD, Barton CJ, Birn-Jeffery A, Miller S, Morrissey D. Is markerless, smart phone recorded two-dimensional video a clinically useful measure of relevant lower limb kinematics in runners with patellofemoral pain? A validity and reliability study. Phys Ther Sport. 2020;43:36–42. doi.org/10.1016/j.ptsp.2020.02.004
- Ota M, Tateuchi H, Hashiguchi T, Ichihashi N. Verification of validity of gait analysis systems during treadmill walking and running using human pose tracking algorithm. Gait Posture. 2021;85:290–297. doi.org/10.1016/j.gaitpost.2021.02.006
- Borba EF, Inda AR, Herberts BM, Alves LL, Ibrahim BM, Fernandes FMM, et al. Agreement and repeatability of a smartphone-based markerless system (OpenCap) versus marker-based motion capture during treadmill walking and running. J Appl Biomech. 2026;42(5):409–418. doi.org/10.1123/jab.2026-0021
- Wille CM, Lenhart RL, Wang S, Thelen DG, Heiderscheit BC. Ability of sagittal kinematic variables to estimate ground reaction forces and joint kinetics in running. J Orthop Sports Phys Ther. 2014;44(10):825–830. doi.org/10.2519/jospt.2014.5367
Educational content for health professionals. It does not replace clinical assessment or reading the original studies.